 Different KPIs are available throughout the Portal.
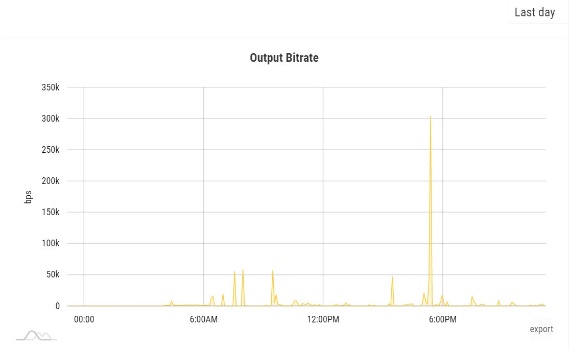
For Connectors and Cloud Virtual Interfaces, it is the Output and Input
bitrates. For Links, it is the Latency, Jitter, and Packet Loss.
Different KPIs are available throughout the Portal.
For Connectors and Cloud Virtual Interfaces, it is the Output and Input
bitrates. For Links, it is the Latency, Jitter, and Packet Loss.
KPIs are measured every 5 minutes. Networks KPIs are retained for 1 year.
Every graphic is displayed the same way. The user accessing the graphics may export the KPIs in image or data format and inspect the KPIs for a specified period.
Exporting KPIs
To export the Connector's KPIs in Image (PNG, JPG, PDF) or Data (JSON, CSV, XLSX) format, move the mouse over the "Export" button on the bottom right of a graphic, the select Image or Data, and then the desired file format.
Changing the period
By default, graphics are displayed for the "Last day". To select another period, click on the "Last day" button, on the top right corner, and select the appropriate period. Then choose between:
-
Last day
-
Last week
-
Last month
-
Last 90 days
-
Or a Custom period with the date picker.
Then click outside of the date picker. The graphics refresh to the specified period.
